What the profile costs
A laboratory says a steep descent costs half as much as flat ground. 8,491 ultra finishers say it costs more than flat. This is how the effort curve behind every number on this site was measured, tested against a course it had never seen, and where it stops.
One curve under everything
Every course here is converted to effort-km: the distance it would be on flat ground. To do that, each metre of the route is priced by its gradient. A 10 % climb costs more than flat, a gentle descent maybe less. The rule that sets those prices is a single curve, and the effort factor, the course comparisons and the fade measurements all rest on it. If the curve is wrong, they are wrong in the same direction.
What the laboratory says
The standard reference is Minetti and colleagues (2002), who measured the energy cost of running on a treadmill at gradients from −45 % to +45 %. Their uphill curve is solid and widely used. Their downhill curve says something surprising: running down a 20 % slope costs half the energy of running on the flat.
That is true for oxygen. It is not what happens to pace in an ultra. Steep descents are braked, footing is chosen step by step, and on tired legs nobody runs them at half the effort of a flat road. The question is how far off the laboratory curve is, and in which direction.
Measuring it from races
The idea is simple. If the curve prices the terrain correctly, then once every stretch between two timing points is converted to effort-km, the field’s pace should be smooth: slowly fading over the race, but without jumps. A wrong curve leaves a sawtooth: climbs look suspiciously slow and descents suspiciously fast, or the other way round. The best curve is the one that flattens the sawtooth most.
Two things make this harder than it sounds:
- Aid-station time is not terrain. A stretch that ends in a valley aid station looks slow if the stop is counted, and the descent before it gets the blame. Only stretches where the timing mats record the stop, or where there is no aid station at all, are used: 8,491 finishers on nine courses.
- Courses that share trails are not independent. UTMB, CCC and OCC run on the same mountain. So the curve is always tested on a course family it was not fitted on: UTMB Mont-Blanc, Lavaredo, Val d’Aran and Nice Côte d’Azur, one at a time.
Descents are not free
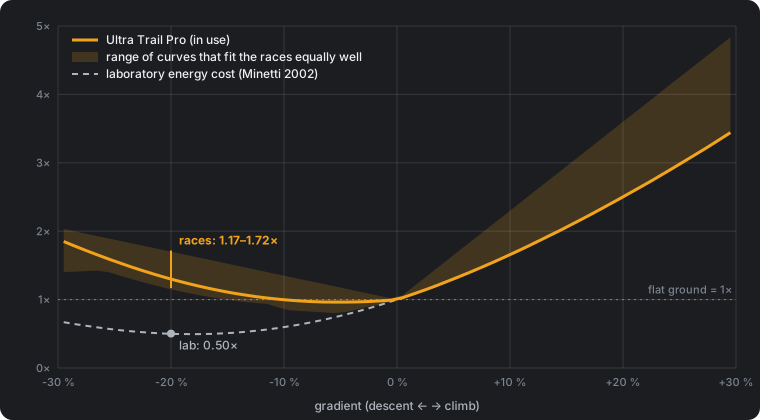
Every curve that fits the races prices a 20 % descent at 1.2 to 1.7 times flat, against 0.5 in the laboratory. Moderate descents, around −5 to −10 %, cost roughly what flat ground does. The curve in use is the laboratory curve plus a descent penalty that grows with steepness:
cost = Minetti(gradient) + 14.4 × |gradient| on descents, Minetti on climbs.
Three alternative shapes were tested against it on left-out courses: a squared penalty, a floor that keeps moderate descents from getting cheaper than flat, and a curve that makes steep climbs cheaper for walking. None of them did better. Some fitted the data they were built on better, which is the usual sign of a curve learning noise. A freely shaped curve, fitted only to show what the data says, is part of the shaded range.
Lab: a 20 % descent costs half of flat ground. Races: it costs more than flat ground.
What about simple rules?
Two rules of thumb are common. ITRA counts km + D+/100: every 100 m of climbing is worth one flat kilometre and descents are free. A simple way to compensate for descents adds them at half that rate, km + D+/100 + D−/200, on the grounds that descending damages muscle.
For ranking whole courses, the choice barely matters. All three put the same races in the same order (rank correlation 0.998); they differ in scale. On the same profile, UTMB 2026 comes to 272 by ITRA, 321 with descents added and 257 effort-km here.
Inside a race they do differ, because a fixed rule cannot tell a runnable descent from a steep one:
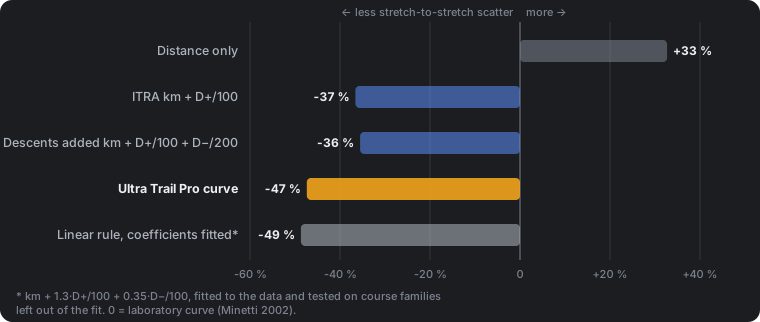
The interesting row is the last one. The same simple form, with coefficients fitted to the data (about km + 1.3·D+/100 + 0.35·D−/100), does as well as our curve on courses it has not seen. The weakness of the rules of thumb is their numbers, not their form.
The reason for charging descents, muscle damage, is real, but it is a cost that arrives later: legs that were hammered at kilometre 60 are slower at kilometre 120. That belongs to fatigue, which is measured separately here, and testing whether descending speeds up the fade is the next question on the list.
One curve, two terrains
Nice Côte d’Azur is the first non-alpine course in the data where the stops are recorded: long, mostly moderate descents through Mediterranean scrub down to the sea. It was fetched to test the curve on terrain it was not built for.
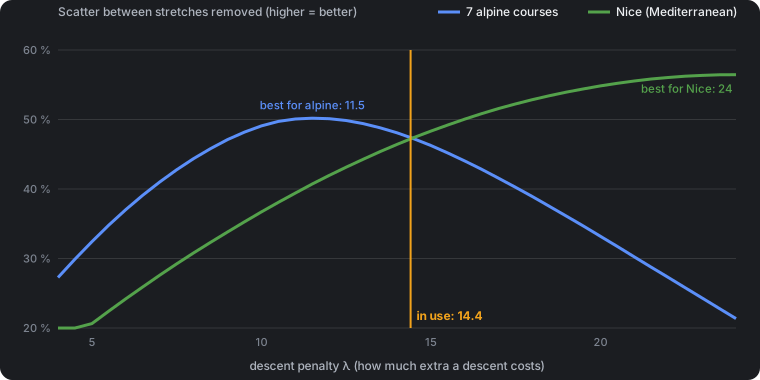
The alpine courses are explained best with a penalty of about 11.5; Nice wants roughly twice that. The value in use, 14.4, sits where the two cross: it removes 47 % of the sawtooth in both terrains. A value tuned to the Alps would score 1.5 points better overall and clearly worse on Nice. Since the point of the comparisons is to put courses from different terrains on one scale, the balanced value stays.
Why does Nice want more? Not because its descents are gentler: on the stretches used, the typical descent on the 100-mile course is as steep as on the CCC. The difference is something the gradient does not see, most likely rocky footing and heat. One curve cannot carry that, and it is the clearest limit of the method.
Where the curve stops
- The exact shape is not known, only the direction. Each stretch mixes flat, climbing and descending, so race splits cannot fully separate “hills are expensive” from “flat is cheap”. A 10 % descent could cost anything from about 0.85 to 1.35 times flat. What the data does say firmly is that steep descents are not cheap.
- Tested on alpine courses and one Mediterranean course. The Californian canyons and Gran Canaria are measured with the same curve, but their aid-station stops are not recorded, so they cannot test it.
- Gradients beyond ±30 % make up about 3 % of the distance in the data. The curve continues there, but nothing in the races pins it down.
- Surface is not in it. Rock, mud, snow and heat change the price of the same gradient. Courses where they dominate are measured as if they did not.
- Moving time only. Stops at aid stations are their own topic and are not part of the curve.
What changed
Nothing in the numbers. The curve in use since September is the one that survived: it is now measured on clean data, tested on a terrain it was not fitted to, and four alternatives lost to it. What changed is that its limits are written down.
Method notes.
- Data: finishers’ splits from nine courses, latest edition each: UTMB, CCC, OCC, Lavaredo 120K and 80K, Val d’Aran VDA and 100K, Nice 100M and 100K. Courses resampled from the official GPX to an 80-metre grid. Stretches with an unrecorded aid stop are left out; a course needs at least four clean stretches to take part.
- Measure: each runner’s pace per stretch on the effort axis, normalised to their own average; the field median per stretch; a straight-line fade trend removed; the remaining spread is the sawtooth. Courses are weighted by how many stretches they contribute.
- Validation: every parameter is chosen on three course families and scored on the fourth.
- Reference: Minetti AE, Moia C, Roi GS, Susta D, Ferretti G (2002). Energy cost of walking and running at extreme uphill and downhill slopes. Journal of Applied Physiology 93:1039–1046.
More on how the race pages are measured: How it is measured.